How Digital Imaging Analysis Software Eliminates Human Error in Industrial Metallurgy
By Radical Scientific — Applications TeamPublished: 15 October 2026
Focus: A practical guide for quality control engineers, metallurgists, and lab procurement officers on why manual, eyeball-against-reference-plate grading introduces measurement error into metallography — and how automatic image analysis software closes that gap, with real modules and standards from Radical Scientific's RI Metal 1.2 software.
Grain size grading, inclusion rating, and phase analysis have traditionally depended on a trained metallurgist comparing a field of view under the microscope against a printed reference chart and assigning a rating by eye. Two experienced engineers looking at the same sample can, and routinely do, arrive at different ratings — and the same engineer can rate the same sample differently on a tired afternoon versus a fresh morning. Neither result is wrong by the standard's rules; both are simply subjective within the tolerance the human eye allows.
This guide walks through where that subjectivity creeps in, and how automated digital imaging analysis removes it from the measurement itself.
Where human error enters manual metallography
Manual grading is not careless — it is simply limited by what a human eye, a reference plate, and a stopwatch can hold consistent across a shift. The most common sources of error:
What happens on the bench
Underlying cause
Consequence
Two engineers rate the same field of view differently
Subjective comparison against a printed reference plate instead of a measured threshold
Inconsistent pass/fail decisions on the same batch
Grading drifts across a long shift
Operator fatigue affects visual judgement over repeated samples
Unreliable results late in the day versus early
No record of how a rating was reached
Paper logbook captures only the final grade, not the image or the comparison
No audit trail for customer or certification disputes
Reference plates fade or wear with use
Physical charts degrade and are rarely recalibrated
Silent drift in grading standard over years
Switching between standards is slow
Each standard (GOST, ASTM, DIN, JIS) needs its own chart and procedure, applied manually
Bottlenecked throughput when orders require multiple standards
The fix is to measure, not compare by eye. Automatic image analysis software applies the same thresholding and classification logic to every sample, every time — the rating no longer depends on which engineer is at the microscope or what time of day it is.
Step 1 — Replace visual comparison with automatic measurement
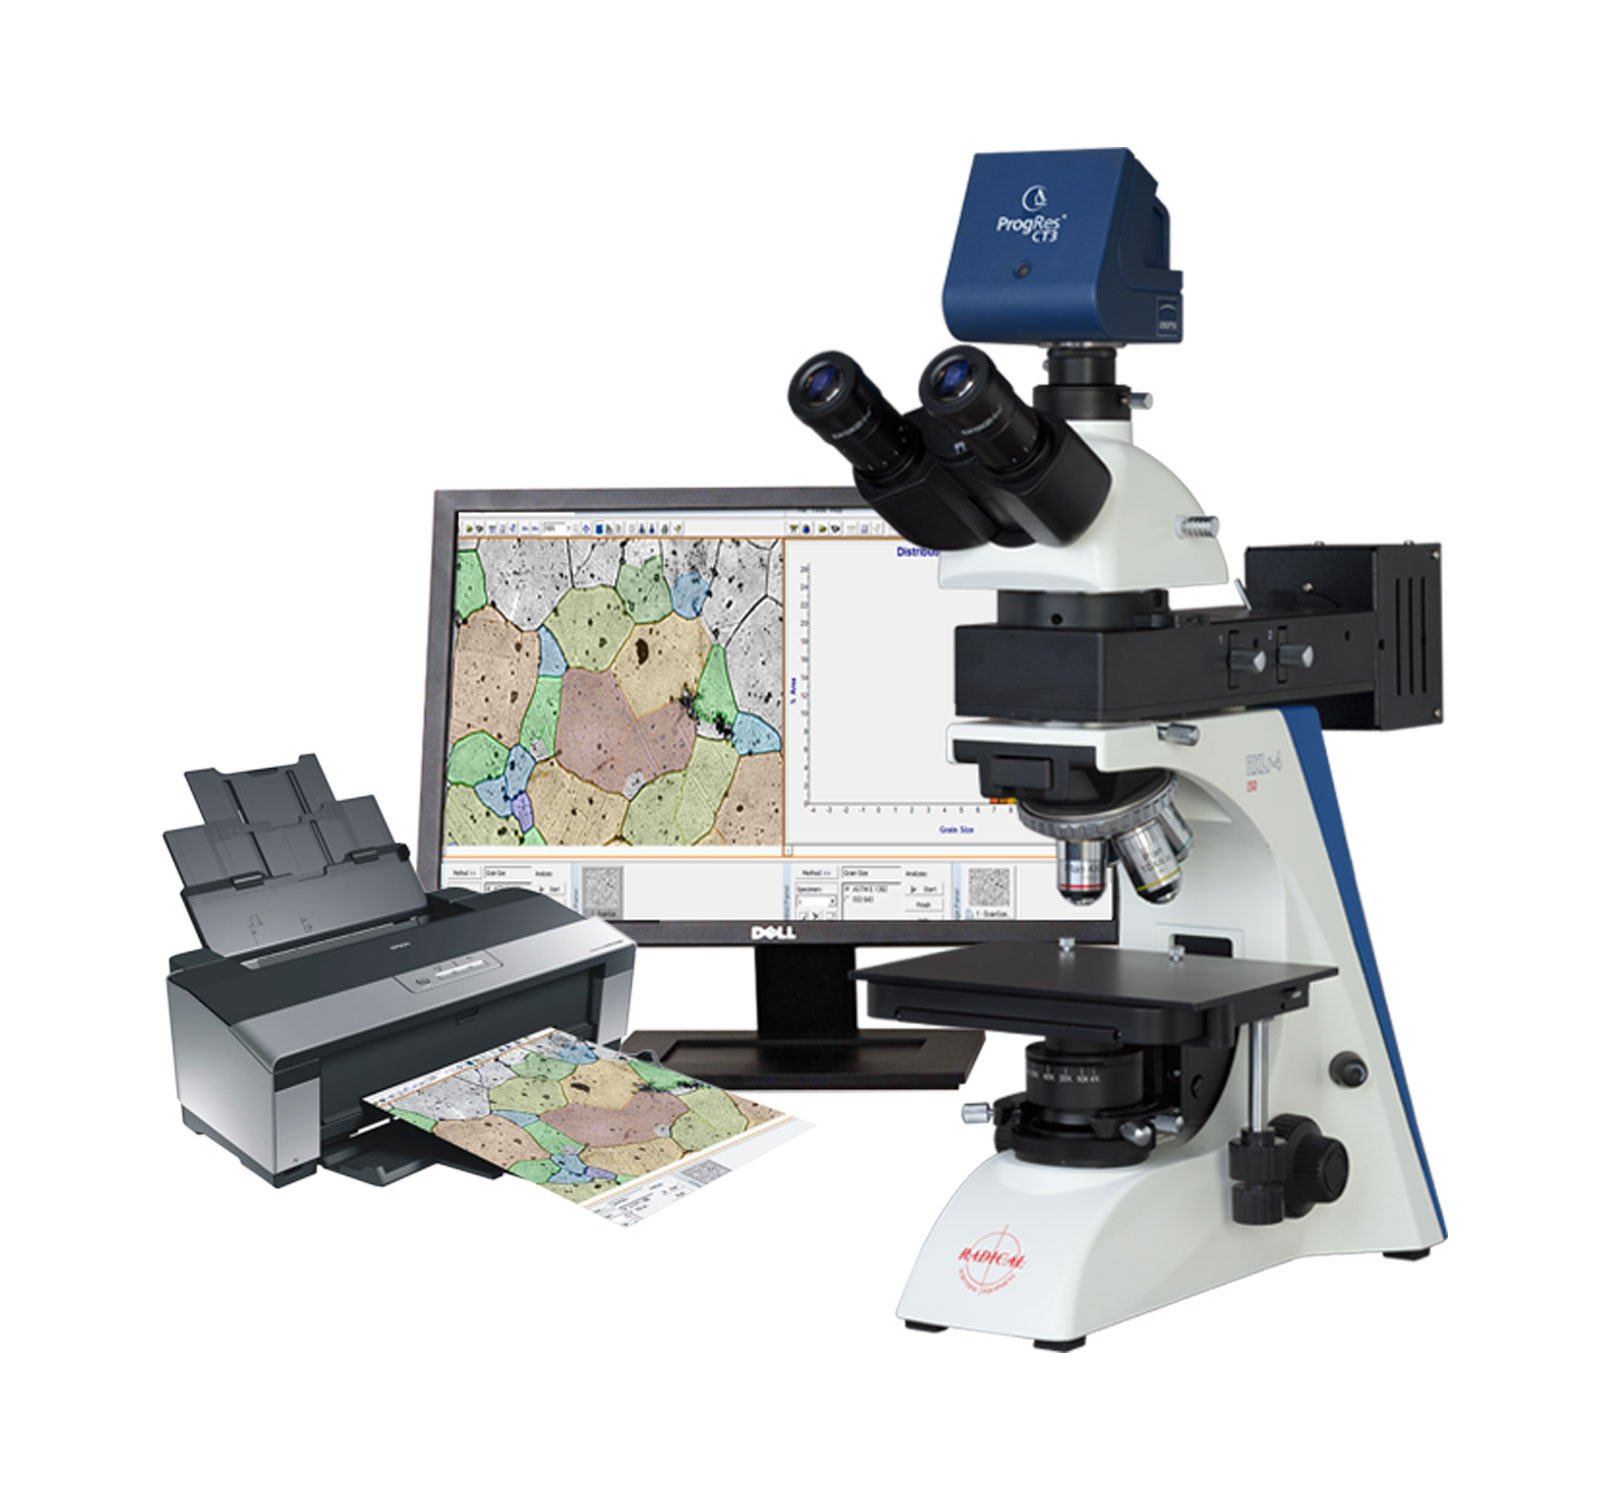
Radical Scientific's RI Metal 1.2 automatic image analyzer software is built to replace the reference-plate comparison step directly. Rather than an engineer matching a field of view to the closest printed chart entry by eye, the software measures the image against the standard's defined thresholds and reports a result with built-in charts for GOST and ASTM standards to compare and justify the output — the same measurement, repeatable, with a record attached.
Fast switching between different standards means a single sample set can be graded to GOST, ASTM, DIN, or JIS without re-setting up a different physical reference chart for each one — directly addressing the multi-standard bottleneck that slows manual grading down.
Step 2 — Get a measurement-grade image before you analyse it
Analysis software is only as accurate as the image it is given. A soft, unevenly lit, or inconsistently framed field of view will carry that imprecision straight into the automated measurement. This is why RI Metal 1.2 is best used with a research-grade metallurgical microscope rather than a generic camera setup.
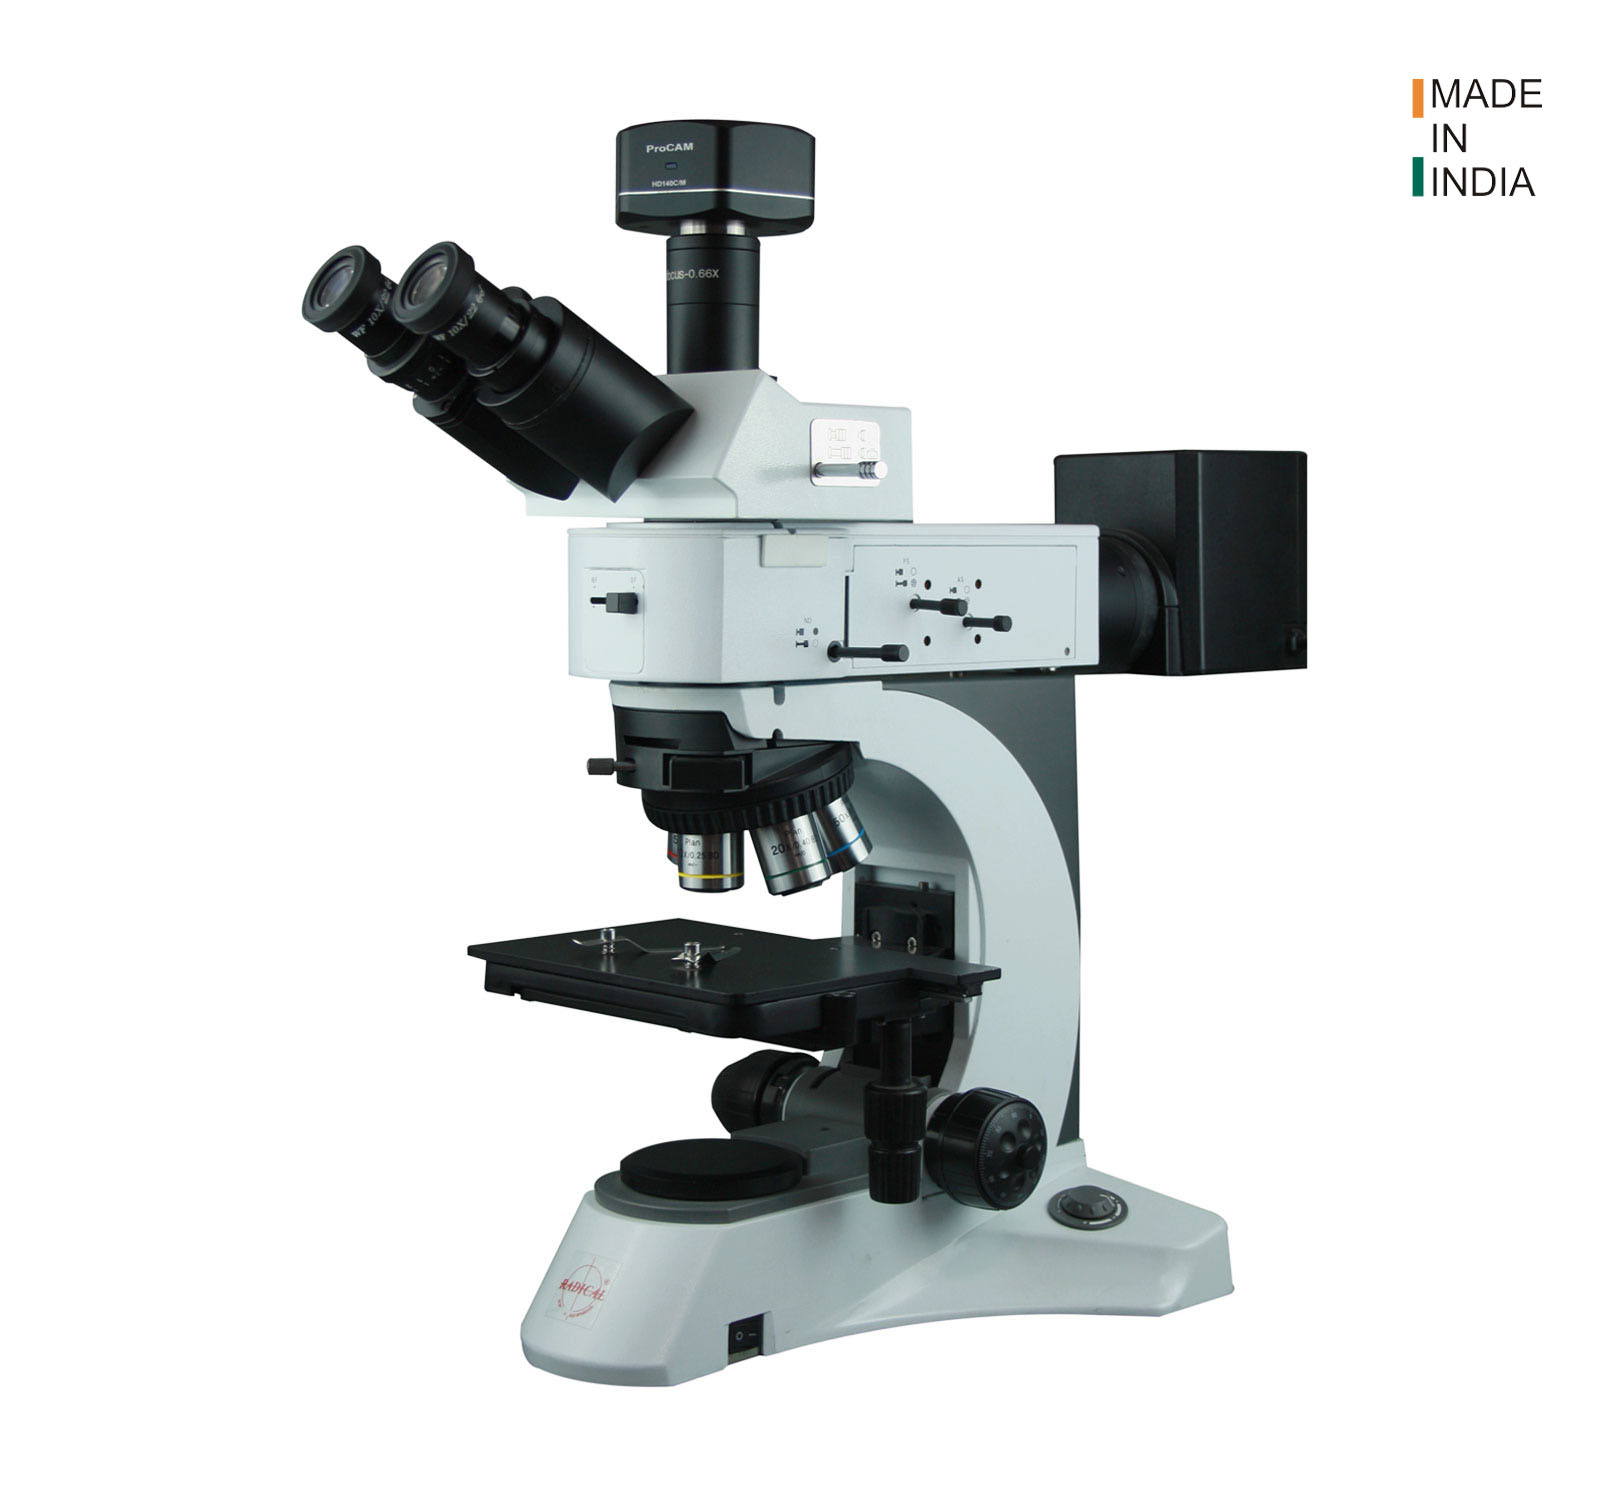
RXLr-5M Research Material Microscope
The RXLr-5M research material microscope offers multi-mode system expandability for metallurgical bright field, dark field, and polarization observation, through a universal infinite optical system (IOS) with colour-corrected (CCIS) optics and Koehler illumination for even, reproducible field lighting. It is available with a trinocular siedentopf head carrying a dedicated camera port (with a choice of eyepiece-to-camera splitting ratios) for photomicrography, and motorised X-Y stage and Z-axis focusing keep repeat captures consistent operator to operator.
Image quality in, measurement quality out. Our expert engineers can confirm the right microscope and camera combination for the standards and specimen types your lab grades most — talk to an expert engineer.
Step 3 — Confirm the software covers the standards you grade against
RI Metal 1.2 ships with seven analysis modules, each mapped to the published standards that governed the manual version of that same test:
Module
What it measures
Standards covered
Grain size
Steel grain size and prior austenite grain size, including non-ferrous metals and alloys
ASTM E112, E1382, E930; ISO 643; DIN EN ISO 643-2003
Non-metallic inclusion
Inclusion type (oxides, sulphides, oxide-sulphides) and rating
ASTM E45, E1245, E1122; ISO 4967; DIN 50602
Phase analysis
Ferrite/pearlite ratio, ferrite content in austenitic steel, carbide inhomogeneity in alloy tool steels, martensite needle length
Before committing to any image analysis software, confirm it covers the exact modules your lab certifies against — a system that only covers grain size is of limited use to a lab that also certifies inclusion rating and decarburisation depth on the same components.
Special case — statistically defensible, audit-ready reporting
A single field of view is a snapshot, not a statistically sound characterisation of a sample. RI Metal 1.2 is built to work with a minimum of 30 images from a single sample and base its result on the accumulated data, and to analyse a minimum of 6 similar samples together, basing the result on the accumulated data across the full sample set and their multiple analyses — turning a one-off visual call into a documented, repeatable measurement.
Every analysis carries automatic data reporting of material characteristics, images, and results into a built-in database, with automatic measurement of individual and total analysed area, and automatic calibration-scale overlay on every image. When a customer or certification body questions a result months later, the image, the measurement, and the standard applied are all on record — not just a number in a logbook.
Built-in comparison charts, not manual reference plates
✓ Image Capture
Minimum 1024 x 980 pixel image size
Even, reproducible Koehler illumination
Motorised stage for consistent repeat captures
✓ Statistical Reliability
Minimum 30 images per sample supported
Minimum 6 samples analysed together
Results based on accumulated, not single-frame, data
✓ Documentation
Automatic report of images, data and results
Built-in database for audit trail
Automatic calibration-scale overlay on every image
Imaging and analysis equipment from Radical Scientific
Radical Scientific has manufactured laboratory and metallography equipment since 1975. RI Metal 1.2 and the RXLr-5M series are part of the current metallurgical inspection range.
Image Analysis Software
RI Metal 1.2 — Automatic image analyzer, GOST/ASTM/DIN/JIS
Metallurgical Microscopes
RXLr-5M — Research material microscope, multi-mode
How does image analysis software reduce human error compared to manual grading?
Manual grading compares a field of view to a printed reference plate by eye, which varies between operators and across a shift. Image analysis software applies the same measurement and thresholding logic to every image, every time, and records the image and result alongside it — removing the operator-to-operator and time-of-day variation inherent in visual comparison.
Does RI Metal 1.2 support multiple metallurgical standards?
Yes. RI Metal 1.2 includes modules for grain size, non-metallic inclusion, phase analysis, graphite in ferrous methods, Vickers and Knoop hardness methods, decarburised layer depth, and SEP 1520 carbide morphology, with fast switching between GOST, ASTM, DIN, and JIS standards and built-in comparison charts.
What microscope is needed to use image analysis software effectively?
A research-grade metallurgical microscope with even, reproducible illumination (such as Koehler illumination), a camera port on the viewing head, and ideally a motorised stage for consistent repeat captures — such as the RXLr-5M research material microscope. A lower-quality or inconsistently lit image will limit the accuracy of any analysis software, regardless of its capability.
How many images or samples does RI Metal 1.2 need for a statistically valid result?
The software is built to work with a minimum of 30 images from a single sample, and can analyse a minimum of 6 similar samples together, basing results on the accumulated data across the full set rather than a single field of view.
Is there an audit trail if a result is questioned later?
Yes. RI Metal 1.2 automatically reports material characteristics, images, and analysis results into a built-in database, with automatic measurement of analysed area and calibration-scale overlay on every image, so the original image and measurement are available for review.
How much does RI Metal 1.2 cost in India?
Contact Radical Scientific at 1800-1233-229 or info@radicalscientific.com for current pricing and a recommendation matched to the standards and sample volumes your lab certifies against.